Many process control practitioners tune by “intuition,” fiddling their way to final tuning by a combination of experience and trial-and-error.
Some are quite good at approaching process control as art. Since they are the ones who define “best” performance based on the goals of production, the capabilities of the process, the impact on down stream units, and the desires of management, it can be difficult to challenge any claims of success.
To explore the pitfalls of a trial and error approach and reinforce that there is science to controller tuning, we consider the common dependent, ideal form of the PI controller:
![]()
Where:
CO = controller output
e(t) = controller error = set point – process variable = SP – PV
Kc = controller gain, a tuning parameter
Ti = reset time, a tuning parameter
For this form, controller activity or aggressiveness increases as Kc increases and as Ti decreases (Ti is in the denominator, so smaller values increase the weighting on the integral action term, thus increasing controller activity).
Since Kc and Ti individually can make a controller more or less aggressive in its response, the two tuning parameters interact with each other. If current controller performance is not what we desire, it is not always clear which value to raise or lower, or by how much.
Example of Interaction Confusion
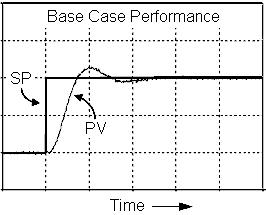
To illustrate, consider a case where we seek to balance a fairly rapid response to a set point change (a short rise time) against a small overshoot. While every process application is different, we choose to call the response plot below our desired or base case performance.

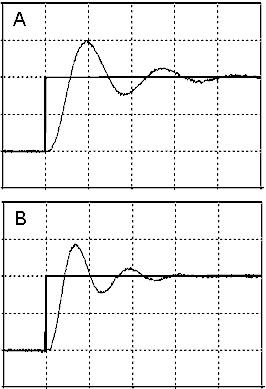
Now consider the two response plots below. These were made using the identical process and controller to that above. The only difference between the base case response above and plot A and plot B below is that different Kc and Ti tuning values were used in each one.
And now the question: what tuning adjustments are required to restore the desired base case performance above starting from each plot below? Or alternatively: how has the tuning been changed from base case performance to produce these different behaviors?
There are no tricks in this question. The “process” is a simple linear second order system with modest dead time. Controller output is not hitting any limits. The scales on the plot are identical. Everything is as it seems, except PI controller tuning is different in each case.
Study the plots for a moment before reading ahead and see if you can figure it out. Each plot has a very different answer.

Some Hints
Before we reveal the answer, here is a hint. One plot has been made more active or aggressive in its response by doubling Kc while keeping Ti constant at the original base case value.
The other cuts Ti in half (remember, decreasing Ti makes this PI form more active) while keeping Kc at the base case value:
So we have:
• Base case = Kc and Ti
• Plot A or B = 2Kc and Ti
• Other Plot B or A = Kc and Ti/2
Still not sure? Here is a final hint: remember from our previous discussions that proportional action is largely responsible for the first movements in a response. We also discussed that integral action tends to increase the oscillatory or cycling behavior in the PV.
It is not easy to know the answer, even with these huge hints, and that is the point of this article.
The Answer
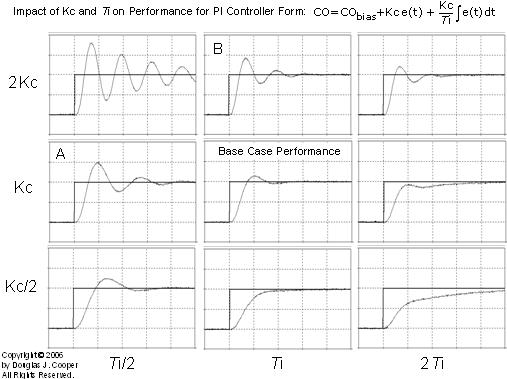
Below is a complete tuning map (click for a large view) with the base case performance from our challenge problem in the center. The plot shows how performance changes as Kc and Ti are doubled and halved from the base case for the dependent, ideal PI controller form.
Starting from the center and moving up on the map from the base case performance brings us to plot B. As indicated on the tuning map axis, this direction increases (doubles) controller gain, Kc, thus making the controller more active or aggressive. Moving down on the map from the base case decreases (halves) Kc, making the controller more sluggish in its response.
Moving left on the map from the base case brings us to plot A. As indicated on the tuning map axis, this direction decreases reset time (cuts it in half), again making the controller more active or aggressive. Moving right on the map from the base case increases (doubles) reset time, making the controller more sluggish in its response.
It is clear from the tuning map that the controller is more active or aggressive in its response when Kc increases and Ti decreases, and more sluggish or conservative when Kc decreases and Ti increases.
Building on this observation, it is not surprising that the upper left most plot (2Kc andTi/2) shows the most active controller response, and the lower right most plot (Kc/2 and 2Ti) is the most conservative or sluggish response.
Back to the question. With what we now know, the answer:
• Base case = Kc and Ti
• Plot B = 2Kc and Ti
• Plot A = Kc and Ti/2
Interacting Parameters Makes Tuning Problematic
The PI controller has only two tuning parameters, yet it produces very similar looking performance plots located in different places on a tuning map.
If our instincts lead us to believe that we are at plot A when we really are at plot B, then the corrective action we make based on this instinct will compound our problem rather than solve it. This is strong evidence that trial and error is not an efficient or appropriate approach to tuning.
When we consider a PID controller with three tuning parameters, the number of similar looking plots in what would be a three dimensional tuning map increases dramatically. Trial and error tuning becomes almost futile.
We have been exploring a step by step tuning recipe approach that produces desired results without the wasted time and off-spec product that results from trial and error tuning.
If we follow this industry-proven methodology, we will improve the safety and profitability of our operation.
Interesting Observation
Before leaving this subject, we make one more very useful observation from the tuning map. This will help build our intuition and may help one day when we are out in the plant.
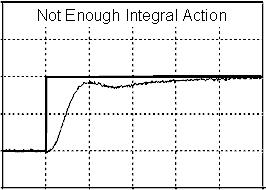
The right most plot in the center row (Kc, 2Ti) of the tuning map above is reproduced below.

Notice how the PV shows a dip or brief oscillation on its way up to the set point? This is a classic indication that the proportional term is reasonable but the integral term is not getting enough weight in the calculation. For the PI form used in this article, that would mean that the reset time, Ti, is too large since it is in the denominator.
If we cover the right half of the “not enough integral action” plot, the response looks like it is going to settle out with some offset, as would be expected with a P-Only controller. When we consider the plot as a whole, we see that as enough time passes, the response completes. This is because the weak integral action finally accumulates enough weight in the calculation to move the PV up to set point.
This “oscillates on the way” pattern is a useful marker for diagnosing a lack of sufficient integral action.


