Like the heat exchanger and gravity drained tanks case studies, the jacketed stirred reactor is a self regulating processes. That is, the measured process variable (PV) naturally seeks a steady operating level if the controller output (CO) and major disturbance (D) are held constant for a sufficient length of time.
And like the heat exchanger and the gravity drained tanks, the jacketed stirred reactor process is actually a sophisticated simulation derived from first-principles theory and available in commercial software. Nevertheless, the methods and procedures we establish during these investigations are directly applicable to a broad range of industrial processes with streams comprised of liquids, gases, powders, slurries and melts.
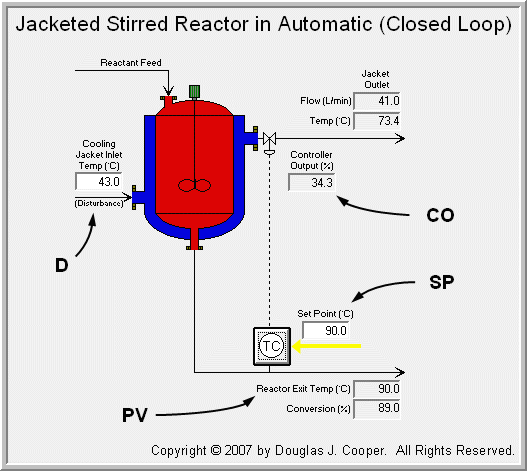
The Jacketed Stirred Reactor
The process, shown below in manual mode, is often called a continuously stirred tank reactor (CSTR).
As labeled in the figure (click for large view), a reactant feed stream enters the top of the vessel. A chemical reaction converts most of this feed into the desired product as the material passes through what is essentially a stirred tank. The stream exiting the bottom of the vessel includes the newly created product plus that portion of the feed that did not convert while in the vessel.

This well mixed reactor has additional considerations we use later in the discussion:
| ▪ | The residence time, or overall flow rate of reactant feed plus product through the vessel, is constant. |
| ▪ | The chemical reaction that occurs is exothermic, which means that heat energy is released as feed converts to product. |
The Function of the Cooling Jacket
The chemical reaction releases heat and this energy causes the temperature of the material in the vessel to rise. As temperature rises, the conversion of feed to product proceeds faster, leading to the release of even more heat.
To stop the upward spiral of hotter temperatures increasing the rate of reaction that produces even more heat, the vessel is enclosed with a jacket (or outer shell). A cooling liquid flows through the jacket, collecting heat energy from the outer surface of the reactor vessel and carrying it away as the cooling liquid exits at the jacket outlet.
When the flow of cooling liquid through the jacket increases, more heat is removed. This lowers the reactor temperature, slowing the rate of the reaction, and thus decreasing the amount of feed converted to product during passage through the reactor.
When the flow of cooling liquid through the jacket decreases, some of the energy from the heat-producing reaction, rather than being carried away with the cooling liquid, accumulates in the vessel and drives the reactor temperature higher. The result is an increased conversion of reactant feed to product.
As shown in the figure below (click for large view), the flow rate of cooling liquid is adjusted with a valve on the cooling jacket outlet stream.
Control Conversion by Controlling Temperature
In this case study, we do not seek 100% conversion of reactant feed to product. Rather, our operating specification is a precise 89% conversion.
Because the reactor has a constant residence time, the amount of heat energy released inside the vessel is directly related to the percent of feed converted to product. By controlling the temperature in the reactor, we can maintain the percent conversion to the desired value.
The vessel is well mixed, so the bulk temperature inside the reactor is about the same as the temperature flowing out the exit stream. Thus, as shown in the process graphic above, we place a temperature sensor in the stream at the bottom of the vessel and our measured process variable (PV) becomes reactor exit temperature.
| Practitioner’s Note: as discussed in this article, there can be benefits to measuring and controlling a related variable that is linked to the actual process variable of interest. In this reactor application, for example, a temperature sensor is significantly less expensive to purchase, install and maintain relative to the alternative of an online analyzer that directly measures chemical composition. Temperature sensors are also rugged and reliable, have a rapid response time, and provide a high accuracy and precision compared to process analyzers. If it provides sufficiently useful information, a “fast, cheap and easy” sensor is the smart choice. |
As the figure reveals, we can achieve our desired 89% conversion by maintaining the reactor exit stream temperature at 90 oC. From an operational view, this means the reactor exit temperature will have a fixed set point (SP) value of 90 oC.
During bump testing, operations personnel tell us that we may briefly move the reactor exit temperature up and down by 2 oC, but they strongly discourage anything more. Thus:
▪ design PV and SP = 90 oC with approval for brief dynamic testing of ±2 oC
The Disturbance
Because we seek to hold conversion to a constant 89% at all times (which is achieved by holding reactor exit stream temperature at 90 oC), disturbance rejection becomes our main controller design concern.
The major disturbance in this jacketed stirred reactor is the result of an unfortunate design. Specifically, the temperature of the cooling liquid entering the jacket changes over time (this situation is surprisingly more common in industrial installations than one might first believe).
As the temperature of the cooling liquid entering the jacket changes, so does its ability to remove heat energy. Warm liquid removes less energy than cool liquid when flowing through the jacket at the same rate.
So “disturbance rejection” in this case study means minimizing the impact of cooling liquid temperature changes on reactor operation.
As labeled in the process graphic, the temperature of the cooling liquid is normally at about 43 oC. On occasion, however, this temperature can climb, sometimes rather rapidly, to as high as 50 oC.
We will design for the worst-case scenario and test our controller when the cooling liquid temperature (our disturbance, D) spikes from 43 oC up to 50 oC in a single step. Thus:
▪ design D = 43 oC with spikes up to 50 oC
The Design Level of Operation (DLO)
The first step of the our four step design and tuning recipe is to establish the design level of operation. In the discussion above, we have completed step 1 by establishing the DLO as:
• Design PV and SP = 90 oC with approval for brief dynamic testing of ±2 oC
• Design D = 43 oC with spikes up to 50 oC