Self Regulating vs Integrating Process Behavior
This case study considers the control of liquid level in a gravity drained tanks process. Like the heat exchanger, the gravity drained tanks displays a typical self regulating process behavior. That is, the measured process variable (PV) naturally seeks a steady operating level if the controller output (CO) and major disturbances are held constant for a sufficient length of time.
It is important to recognize that not all processes, and especially not all liquid level processes, exhibit a self regulating behavior. Liquid level control of a pumped tankprocess, for example, displays a classical integrating (or on-self-regulating) behavior.
The control of integrating processes presents unique challenges that we will explore in later articles. For now, it is enough to recognize that controller design and tuning for integrating processes has special considerations.
We note that, like the heat exchanger and pumped tank process, the gravity drained tanks case study is a sophisticated simulation derived from first-principles theory and available in commercial software. Simulations let us study different ideas without risking safety or profit. Yet the rules and procedures we develop here are directly applicable to the broad world of real processes with streams comprised of liquids, gases, powders, slurries and melts.
Gravity Drained Tanks Process
The gravity drained tanks process, shown below in manual mode (click for a large view), is comprised of two tanks stacked one above the other. They are essentially two drums or barrels with holes punched in the bottom.

A variable position control valve manipulates the inlet flow rate feeding the upper tank. The liquid drains freely out through the hole in the bottom of the upper tank to feed the lower tank. From there, the liquid exits either by an outlet drain (another free-draining hole) or by a pumped flow stream.
The next graphic (click for a large view) shows the process in automatic mode using our standard nomenclature.
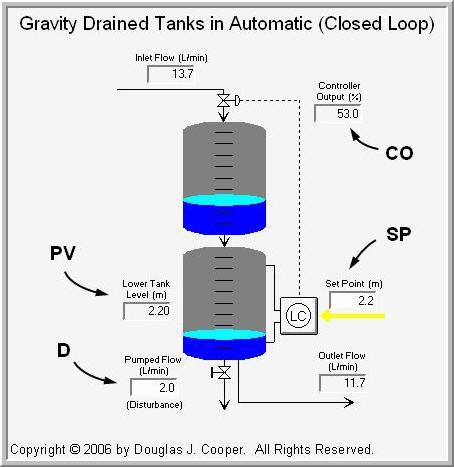
The measured process variable (PV) is liquid level in the lower tank. The controller output (CO) adjusts the valve to maintain the PV at set point (SP).
| Aside: The graphic shows tap lines out of the top and bottom of the lower tank and entering the level sensor/controller. This configuration hints at the use of pressure drop as the level measurement method. As we discuss here, we often choose to use sensors that are inexpensive to purchase, install and maintain to monitor parameters related to the actual variable of interest. While our trend plots in this case study show liquid level, our true measured variable is pressure drop across the liquid inventory in the tank. A simple multiplier block translates the weight of liquid pushing on the bottom tap into this level measurement display. |
So, for example, if the liquid level in the lower tank is below set point:
 the controller opens the valve some amount,
increasing the flow rate into the upper tank,
raising the liquid level in the upper tank,
increasing the pressure near the drain hole,
raising the liquid drain rate into the lower tank,
thus increasing the liquid level in the lower tank.
The Disturbance Stream
As shown in the above graphic, the pumped flow stream out of the lower tank acts as a disturbance to this process. The disturbance flow (D) is controlled independently, as if by another process (which is why it is a disturbance to our process).
Because the pumped flow rate, D, runs through a positive displacement pump, it is not affected by liquid level, though it drops to zero if the tank empties.
When D increases (or decreases), the measured PV level quickly falls (or rises) in response.
Process Behavior is Nonlinear
The dynamic behavior of this process is reasonably intuitive. Increase the inlet flow rate into the upper tank and the liquid level in the lower tank eventually rises to a new value. Decrease the inlet flow rate and the liquid level falls.
Gravity driven flows are proportional to the square root of the hydrostatic head, or height of liquid in a tank. As a result, the dynamic behavior of the process is modestly nonlinear. This is evident in the open loop response plot below (click for a larger view).
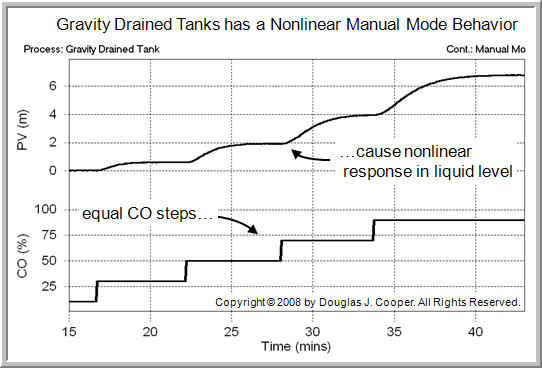
As shown above, the CO is stepped in equal increments, yet the response shape of the PV clearly changes as the level in the tank rises. The consequence of this nonlinear behavior is that a controller designed to give desirable performance at one operating level may not give desirable performance at another level.
Modeling Dynamic Process Behavior
We next explore dynamic modeling of process behavior for the gravity drained tanks.