A fairly common stumbling block for those new to controller tuning relates to step 2 of the controller design and tuning recipe. Step 2 says to “collect controller output (CO) to process variable (PV) dynamic process data around the design level of operation.”
But suppose disturbance rejection is our primary control objective (example studyhere). Shouldn’t we then step or pulse (or “bump”) our disturbance variable to generate the step 2 dynamic process test data?
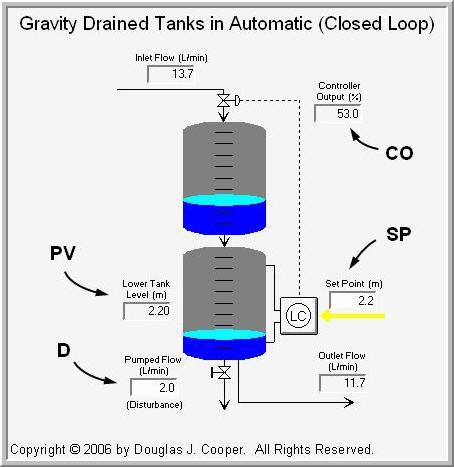
As shown below for the gravity drained tanks process, that would involve bumping D, the flow rate of the pumped stream exiting the bottom tank (click for a large view) and modeling the D to PV dynamic relationship:
The short answer is, no. Tuning a feedback controller based on the D to PV dynamic behavior is a path to certain failure.
Wire Out to Wire In
A controller’s “world” is wire out to wire in. The CO is the only thing a controller can adjust. The PV is the only thing a controller can “see.” The controller sends a CO signal out on one wire. The impact of that action returns as a PV measurement signal on the other wire.
Disturbances, by their very nature, are often unmeasured. Unless a feed forward architecture has been implemented, the controller is only aware of a disturbance when it has already forced the PV from set point (SP). The CO is then the only handle the controller has to correct the problem.
For a controller to take appropriate corrective actions, it must “know” how the PV will respond when it changes the CO. Thus, regardless of the control objective, it is CO to PV relationship that must always be the foundation for controller design and tuning.
Closed Loop Testing
As discussed here, we must use a software tool to fit a model to dynamic process test data that has been collected in automatic mode.
As always, the process must be steady before beginning the test. Also, the controller must be tuned so that the CO actions are energetic enough to force a clear response in the PV, but not be so aggressive that the PV oscillates wildly during data collection.
| ◊ SP Driven Dynamic Data is Good Useful data can be generated by bumping the set point enough to force a clear dynamic response. Below is data from the gravity drained tanks process under P-Only control using a controller gain, Kc = 16 %/m.As shown (click for a large view), the process is initially at a steady operation. The set point is stepped in a doublet, from 2.2 m up to 2.4 m, then down to 2.0 m, and back to the initial 2.2 m. The P-Only controller produces a moderate set point response, with offset displayed as expected from this simple controller. While not shown, the pumped flow disturbance, D, remains constant throughout the experiment. 
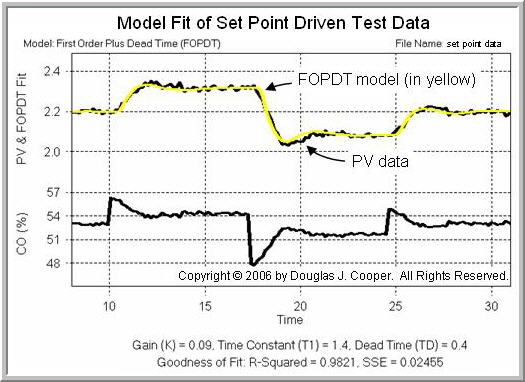
What is important in the above test is that when the set point is stepped, the P-Only controller is sufficiently active to move the CO in the desired “far enough and fast enough” manner to force a clear response in the PV trace. This obvious CO to PV cause-and-effect relationship is exactly what we require in a good data set. Step 3 of the controller design and tuning recipe is to fit a FOPDT (first order plus dead time) model to the dynamic process test data. Below is the results of this fit(click for a large view) using the above set point driven test data and the Control Station software.
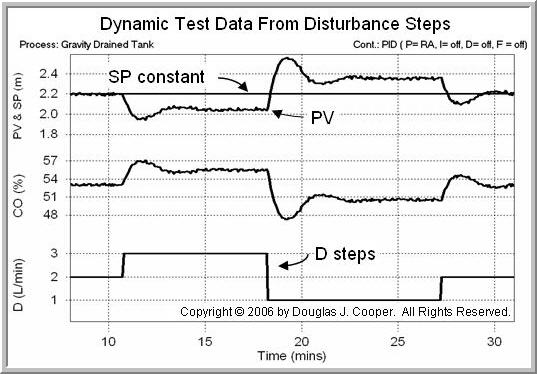
These results will be discussed later in this article. ◊ D Driven Dynamic Data is NOT Good As shown below (click for a large view), D is stepped from 2 L/min up to 3 L/min, down to 1 L/min, and back to 2 L/min. The same P-Only controller used above produces a moderate disturbance rejection response with offset (more discussion on P-Only control, disturbance rejection and offset for the gravity drained tanks can befound here).
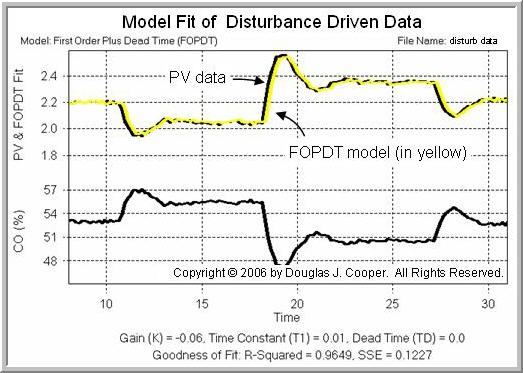
As per step 3 of the recipe, shown below (click for a large view) is a FOPDT model fit of the dynamic process test data from the above experiment:
It is unfortunate that the model fit looks so good, because it may give us confidence that the design is proceeding correctly. |
Comparing Model Fit Results
The table below summarizes our FOPDT model parameters resulting from:
▪ an open loop step test as described here,
▪ the closed loop set point driven test shown above,
▪ the closed loop disturbance driven test shown above.
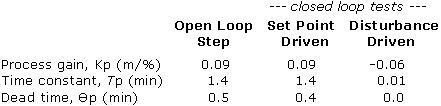
As expected, the set point driven test produces model parameters that are virtually identical to those of the open loop test. And therefore, the controller design and tuning based on either of these two tests will provide the same desirable performance (PI control study using these parameters presented here).
But the disturbance driven model is distressing. The modeling fitting software succeeds in accurately describing the data (and this is a wonderful capability for feed forward control element design), but the parameters of the disturbance driven model are very different from those needed for proper control of the gravity drained tanks.
Perhaps most striking is that the disturbance driven test data yields a negative process gain, Kp. A controller designed from this data would have the wrong action (direct acting or reverse acting). And as a result, the controller would move the valve in the wrong direction, compounding errors rather than correcting for them.
Disturbances Are Always Bad
When generating dynamic process test data, it is essential that the influential disturbances remain quiet. If we are not familiar enough with our process to be sure about such disturbances, it would be best that we not adjust any controller settings.